Introducing GenAI in Analytics
Talk to us about how Analytics can enhance your business travel program

Ask questions like a travel leader, get insights like a data analyst
Revolutionizing business intelligence with real-time AI-powered search, analysis, and insights for the corporate travel world.
Natural language search
Just type in your question like you’re chatting with a friend—who happens to be a data expert.
AI-generated answers
Search results are automatically organized into customizable answers and visuals.
AI-generated synonyms and descriptions
Ask anything, anyway you like. GenAI can understand different ways of saying the same thing.
Human-in-the-loop feedback

If the answer isn’t quite right, you can easily correct it, making the tool smarter and more precise with each use.
Instant AI highlights
See what’s changed with your top KPIs and why within seconds with the click of a button.
Get started with these tips and tricks
Ready to own your data and unleash its power? Download our GenAI in Analytics Trips and Tricks infographic to get started. Learn how to switch on and talk to your personal data analyst now.
Learn more about analytics

Fundamental pillars of data
Fine Figures: How to get the most value out of your travel data

Turning content into actionable insights
A step-by-step guide to turning content into actionable insights

Top tool for modern reporting
Top Tool: What should we expect from modern reporting?

Capitalize on emerging technologies in corporate travel
Technological advancements are accelerating at an unprecedented pace. How will emerging innovations like Generative AI, blockchain, and self-sovereign identity (SSI) transform corporate travel?
Learn more about AI in business travel

AI in business travel: Hype or game-changer?
Have attitudes to Gen-AI reached Gartner’s trough of disillusionment? How does its potential differ from other emerging tech applications in corporate travel?

AI in business travel: Where the opportunities lie
From dynamic data analysis like we’ve never seen before to making travelers and agents hyper-productive , where do the greatest opportunities lie for AI in business travel?

AI in business travel: Managing the risks
Hallucinations, bias and autonomous systems? Is AI risky business, and how do travel industry players safeguard against risk at this critical juncture?

Having data intelligence allowed us to negotiate from a strong position in our commercial agreements with airlines and hotels and identify opportunities for improvement in our policies and processes.”
Santiago Perrone
Procurement Senior Manager | Mercado Libre
AI-powered analytics that learns as you go and gets smarter and more personalized after every use
Select
Select from 200+ data visualizations.
Create
Adapt or create using simple language query.
Understand
Gain swift insights on KPI changes and impact.
Share
Share and collaborate with key stakeholders.
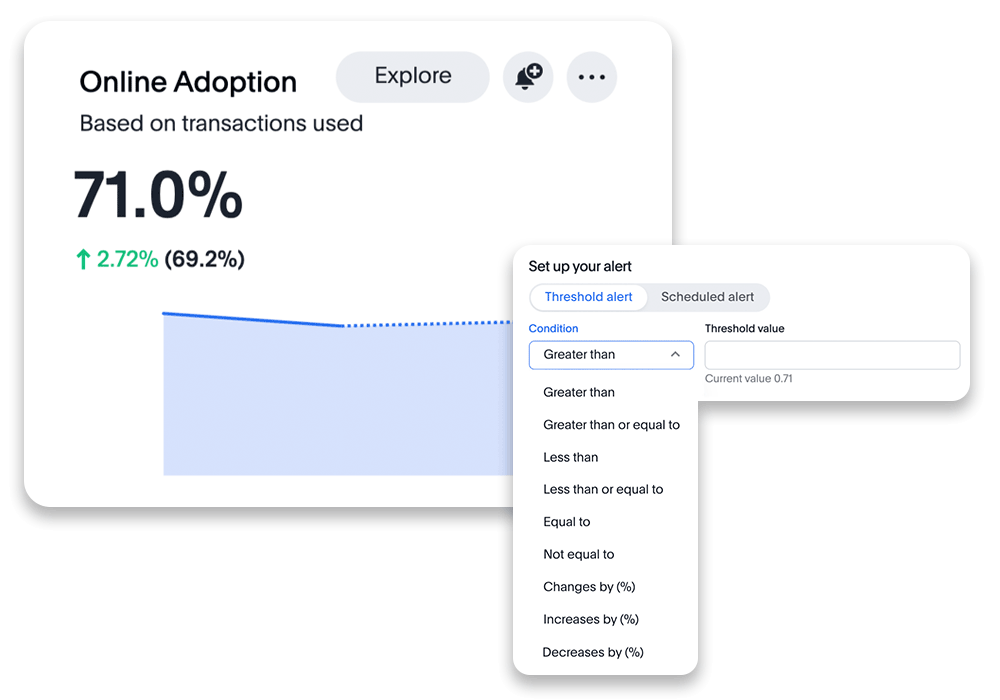
Monitor
Monitor key metrics, receive alerts, take action.
Explore the features that make it easy for anyone to unlock the power of data
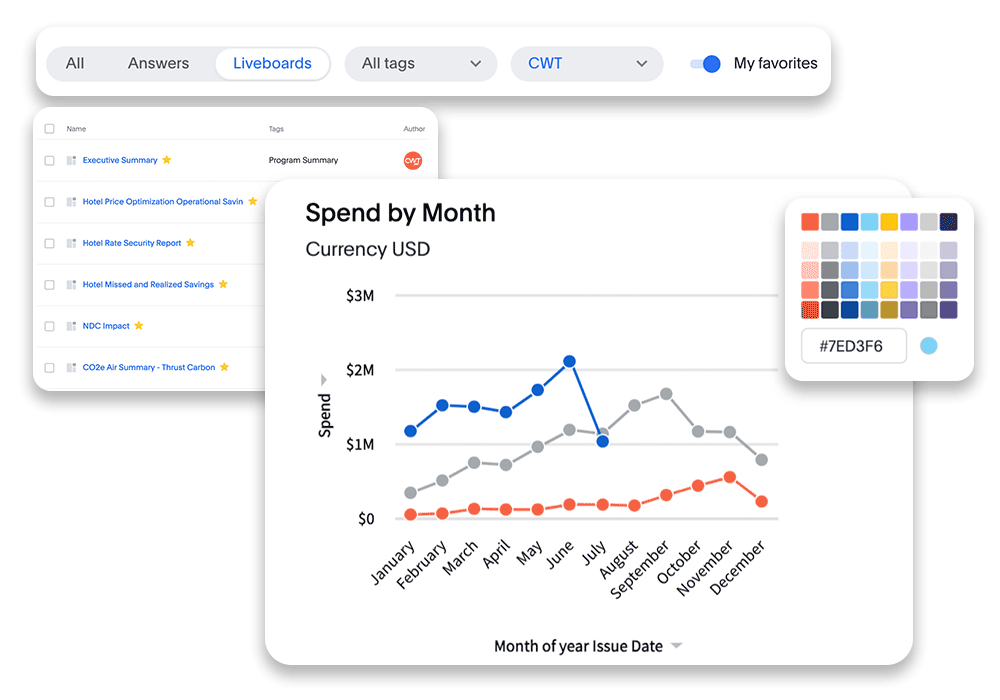
Select
With 200+ data visualizations, select from an extensive library of carefully crafted CWT authored content. You also have the freedom to customize every aspect of your reports. Change colors, rearrange content or add new data to design visually stunning and highly tailored insights that align with your brand, presentation, or specific data analysis needs.
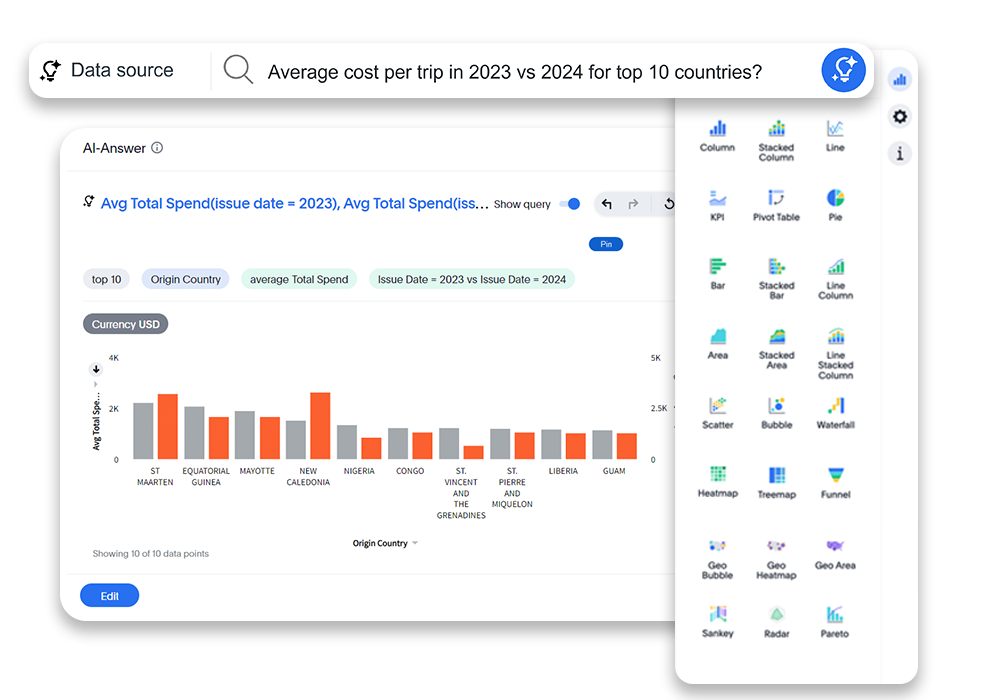
Create
GenAI technology empowers all levels of users to create custom reports through simple language queries. No technical expertise or extensive analysis required. Just type your question and AI transforms your words into actionable data. Quickly extract meaningful insights from complex data sets to help you make informed decisions faster.
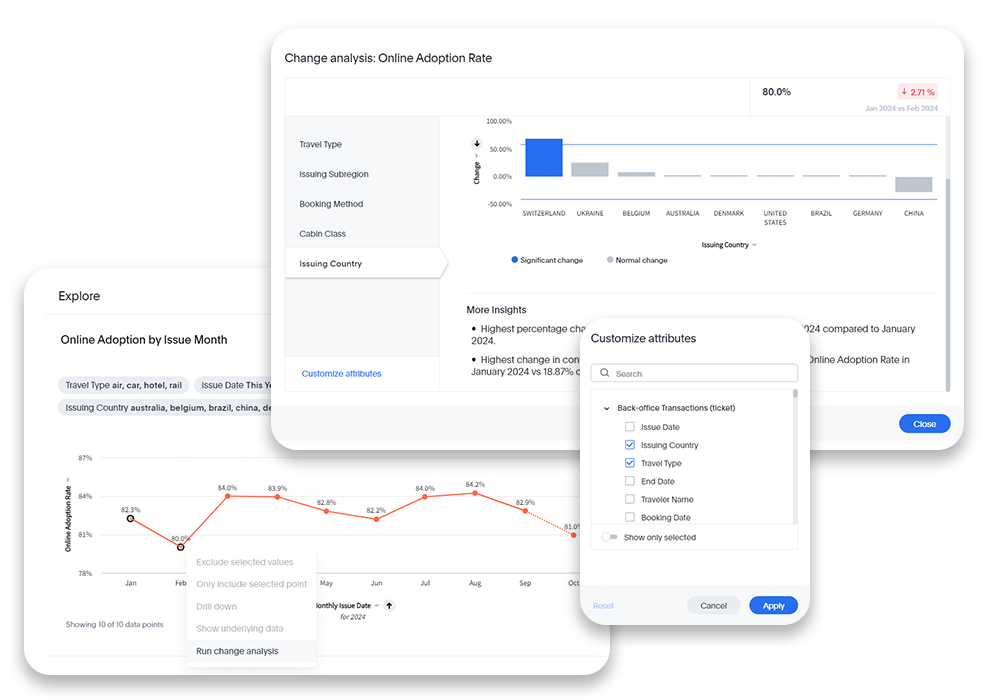
Understand
Understand how and why your KPIs have changed with on-demand change analysis. Simply select the data points you want to compare, and Analytics will run the diagnostics. Curated insights highlight key drivers of change and their statistical impact to help you identify gaps and opportunities.
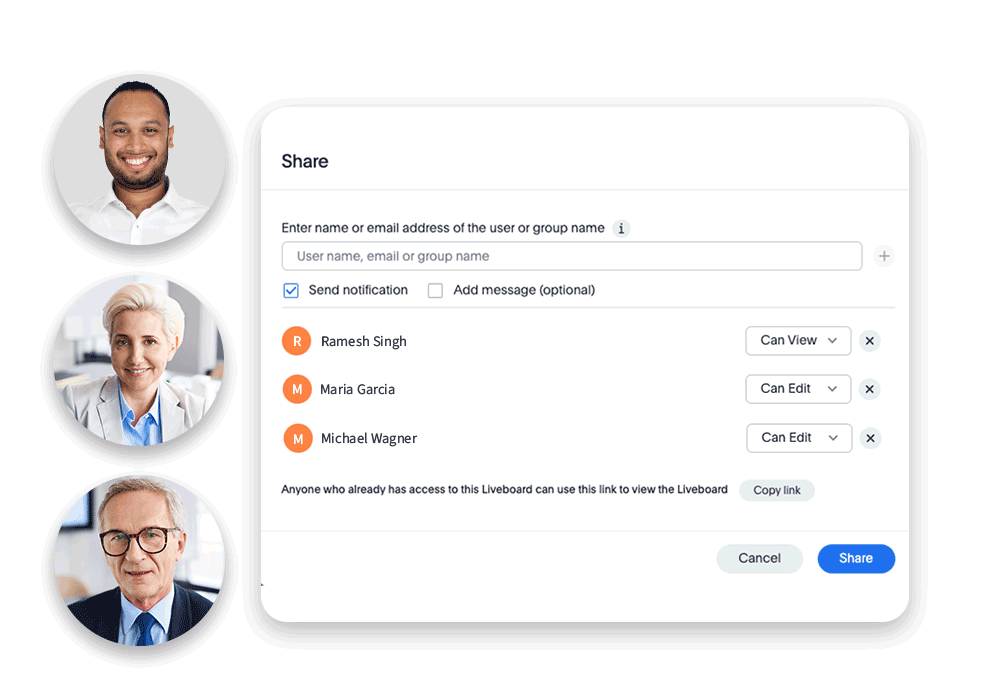
Share
Unlock collaborative potential as you seamlessly share your insights with key stakeholders and colleagues. With just a few clicks, distribute real-time, dynamic reports, empowering your team to stay informed, align strategies, and take decisive actions based on the latest data.
Monitor
With 200+ data visualizations, select from an extensive library of carefully crafted CWT authored content. You also have the freedom to customize every aspect of your reports. Change colors, rearrange content or add new data to design visually stunning and highly tailored insights that align with your brand, presentation, or specific data analysis needs.
We need to make fast, high-quality decisions, and that requires access to data and insights at all-levels of the organization. Analytics makes this possible, empowering companies to democratize data and significantly improve the quality, confidence, and speed of decision-making.”
Cristina Chimenti
Travel buyer and ITM Board Member
Latest insights


It’s an amazing solution that not only speeds up our processes from 15 minutes to 20 seconds but also shows how companies can harness the power of AI without developing it in-house. We’re just scratching the surface of what’s possible, and I’m truly excited about the transformative potential ahead.”
Mario Pires
Head of Digital Travel Experience, Nokia